Introducing Research Reports
A new AI-powered report builder that turns one or many studies into a structured, editable document — with synthesized themes, embedded charts, real participant quotes, and a chat panel that does the analysis with you.
We're launching Research Reports — the fastest way to turn a finished study (or several) into a polished writeup you can share.
Every project ends the same way: hundreds of transcripts, a backlog of insights, and one document to write. Reports collapse that step. Open a new report, link the studies you want to draw from, and work alongside an AI agent that reads interviews, pulls quotes, builds charts, and drafts entire sections — while you stay in control of the document.
A real document, not a dashboard
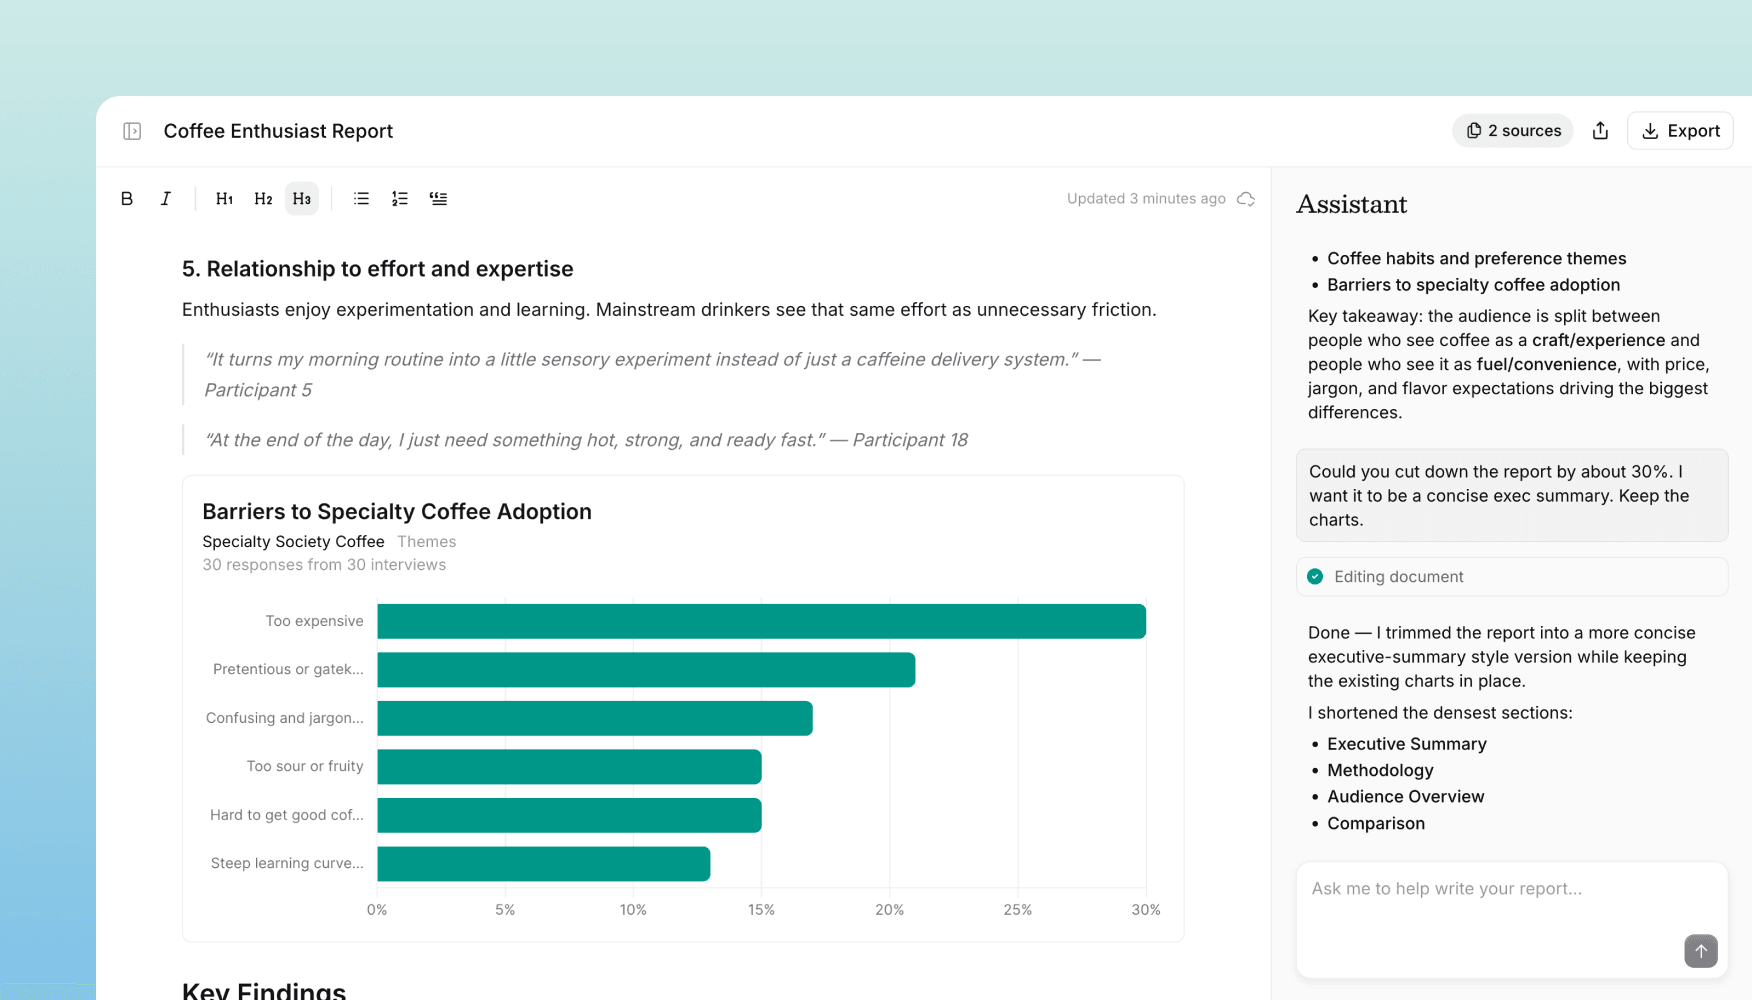
A report opens in a split-pane editor. The document lives on the left; an AI agent lives on the right as a chat panel.
You can ask high-level questions ("What did mid-market customers think about pricing across these three studies?") or precise ones ("Add a chart of satisfaction scores by segment for question 4 of the onboarding study"). The agent does the reading and analysis, and the document updates as it works.
Anything it writes is fully editable. Rewrite a sentence, restructure a section, delete a chart — the document is yours.
What you can ask the agent to do
- Summarize a study, or pull a clean executive summary across many
- Find the best quotes on a topic, with attribution back to the participant
- Extract themes across dozens or hundreds of interviews
- Compare segments — SMB vs. enterprise, US vs. EU, before vs. after a launch
- Build charts from any structured question, including across multiple studies
Charts that live in the document
Charts in Reports aren't screenshots — they're real, interactive visualizations embedded directly in the document. Hover for exact values, ask the agent to update them later for a different segment or question, and export them cleanly to PDF or DOCX when you're ready to share.
Multi-study synthesis
A single report can span as many studies as you want. Link them when you create the report and the agent draws from all of them as one corpus.
This unlocks things that are painful to do by hand:
- Quarterly roundups across every study you ran
- Cross-segment comparisons spanning multiple projects
- Longitudinal themes showing how sentiment has shifted over time
- Stakeholder briefings tailored to a specific feature, team, or decision
Every quote, theme, and chart traces back to the underlying interviews, so the report stays grounded in real data.
How to start
Reports is available now for all customers. Look for the Reports section in the left sidebar to create your first one — link a few studies, and start by asking the agent for a summary.
Get in touch
We're continuing to build features that help you test and learn faster. If you have any questions or feature requests, reach out to us at [email protected]. Want to get started? Sign up today and start running research in minutes.
Eric Li, Co-Founder, Versive